|

|
|
|
|
|
|
|
|
|
|
|
|
|
|
|
Strategic
decisions & Working Capital (WC)
|
|
|
|
|
|
|
Investment
decisions |
|
|
Modes of diversification
: |
|
|
Inter-Organizational relationships
: |
|
|
|
|
|
Others : |
|
|
|
|
|
Long-Term
Financial decisions |
|
|
|
|
|
|
|
Investment
analysis and decision |
|
|
|
|
|
|
|
|
|
|
|
|
|
|
macroeconomic
AGGREGATES
Before taking
any strategic decision managers have to indentify
the pertinent macroeconomic aggregates, the
relations between them and their TRENDS.
| Aggregates |
GDP
= C + I + G + X - M |
| GDP |
total value of final goods
and services produced within a nation
during a given year |
| C |
Household consumption of goods and services |
| I |
physical investment (gross private capital
formation) + additions to inventory |
| G |
Government expenditures |
| X |
Exports |
| M |
Imports |
Three
approaches to calculate GDP
| Approaches |
GDP (Gross Domestic Product) |
| Flow-of-product
approach |
C + I + G + (X
- M) (open
economy) (assumptions
: depreciation = 0, indirect taxes=0) |
| Earnings approach |
Sum of earnings received by household
from firms (wages, rents, interests,
profits) |
| Value-added approach |
GDP = total value added produced by
firms |
Relation
between International Trade & Internal
Macroeconomics
GDP =
C + I + G +( X - M)
GDP -
C - G = S = I + (X - M)
(S - I)
= (X - M)
If X is not equal to M,
that is because S (savings) is not equal
to I. If we want to restore the equilibrium
between X and M, we have to restore
the equilibrium between S and I by using
the three macroeconomic policies :
Macroeconomic
Model for Switzerland (million swiss
francs)
Years |
C |
G |
Invest |
X |
M |
GDP |
| 2 000 |
267 180 |
52 623 |
127 315 |
242 714 |
218 943 |
470 889 |
| 2 001 |
274 669 |
53 992 |
133 912 |
243 016 |
221 436 |
484 153 |
| 2 002 |
274 367 |
55 646 |
126 475 |
234 183 |
208 094 |
482 577 |
| 2 003 |
278 785 |
57 220 |
127 065 |
232 888 |
207 903 |
488 056 |
| 2 004 |
285 515 |
57 835 |
122 566 |
256 811 |
221 967 |
500 760 |
| 2 005 |
292 318 |
58 586 |
141 444 |
280 253 |
251 661 |
520 941 |
| 2 006 |
301 084 |
59 485 |
153 585 |
313 996 |
274 260 |
553 890 |
| 2 007 |
312 287 |
61 409 |
157 846 |
362 790 |
304 622 |
589 710 |
| 2 008 |
322 800 |
64 947 |
167 028 |
387 435 |
329 154 |
613 056 |
| 2 009 |
325 868 |
68 654 |
170 813 |
349 698 |
312 144 |
602 889 |
| 2 010 |
332 997 |
69 847 |
161 578 |
403 977 |
344 563 |
623 835 |
| 2 011 |
336 275 |
71 683 |
181 605 |
421 965 |
375 001 |
636 527 |
| 2 012 |
340 513 |
72 828 |
169 231 |
436 206 |
376 736 |
642 041 |
| 2 013 |
346 865 |
74 708 |
164 934 |
472 005 |
402 999 |
655 513 |
| 2 014 |
349 456 |
76 424 |
169 446 |
435 233 |
365 002 |
665 557 |
| 2 015 |
353 192 |
77 072 |
168 434 |
426 073 |
355 987 |
668 784 |
| 2 016 |
358 300 |
78 054 |
171 218 |
452 949 |
384 198 |
676 323 |
| 2 017 |
365 386 |
78 789 |
178 140 |
455 238 |
391 703 |
685 849 |
| 2 018 |
372 309 |
79 927 |
180 237 |
479 616 |
403 644 |
708 446 |
| 2 019 |
375 648 |
81 401 |
189 354 |
481 064 |
409 267 |
718 201 |
| 2 020 |
361 333 |
84 475 |
207 677 |
445 898 |
402 147 |
697 237 |
| 2 021 |
368 887 |
88 782 |
194 329 |
528 377 |
438 401 |
741 974 |
| 2 022 |
393 824 |
88 877 |
189 023 |
601 080 |
493 160 |
779 643 |
2 023 |
410 148 |
89 978 |
200 668 |
590 138 |
493 786 |
797 146 |
2024
|
|
|
|
|
|
|
Years |
Unemployment rate |
Inflation rate |
2001 |
1,70% |
1,05% |
2002 |
2,50% |
0,62% |
2003 |
3,70% |
0,62% |
2004 |
3,90% |
0,82% |
2005 |
3,80% |
1,12% |
2006 |
3,30% |
1,11% |
2007 |
2,80% |
0,70% |
2008 |
2,60% |
2,47% |
2009 |
3,70% |
-0,48% |
2010 |
3,50% |
0,68% |
2011 |
2,80% |
-1,15% |
2012 |
2,90% |
-1,07% |
2013 |
3,20% |
0,10% |
2014 |
3,16% |
-0,39% |
2015 |
3,42% |
-1,28% |
2016 |
3,30% |
0% |
2017 |
3,30% |
0,80% |
2018 |
2,70% |
0,69% |
2019 |
2,50% |
0,20% |
2020 |
3,50% |
-0,80% |
2021 |
2,60% |
1,50% |
2022 |
2,10% |
2,80% |
2023 |
2,30% |
1,72% |
2024 |
2,80% |
0,60% |
Macroeconomic aggregates for Switzerland : annual variation rates
Years |
∆ C |
∆ G |
∆ Invest |
∆ X |
∆ M |
∆ GDP |
Unemployment rate |
Inflation rate |
2001 |
2,80% |
2,60% |
5,18% |
0,12% |
1,14% |
2,82% |
1,70% |
1,05% |
2002 |
-0,11% |
3,06% |
-5,55% |
-3,63% |
-6,03% |
-0,33% |
2,50% |
0,62% |
2003 |
1,61% |
2,83% |
0,47% |
-0,55% |
-0,09% |
1,14% |
3,70% |
0,62% |
2004 |
2,41% |
1,08% |
-3,54% |
10,27% |
6,76% |
2,60% |
3,90% |
0,82% |
2005 |
2,38% |
1,30% |
15,40% |
9,13% |
13,38% |
4,03% |
3,80% |
1,12% |
2006 |
3,00% |
1,53% |
8,58% |
12,04% |
8,98% |
6,32% |
3,30% |
1,11% |
2007 |
3,72% |
3,23% |
2,77% |
15,54% |
11,07% |
6,47% |
2,80% |
0,70% |
2008 |
3,37% |
5,76% |
5,82% |
6,79% |
8,05% |
3,96% |
2,60% |
2,47% |
2009 |
0,95% |
5,71% |
2,27% |
-9,74% |
-5,17% |
-1,66% |
3,70% |
-0,48% |
2010 |
2,19% |
1,74% |
-5,41% |
15,52% |
10,39% |
3,47% |
3,50% |
0,68% |
2011 |
0,98% |
2,63% |
12,39% |
4,45% |
8,83% |
2,03% |
2,80% |
-1,15% |
2012 |
1,26% |
1,60% |
-6,81% |
3,37% |
0,46% |
0,87% |
2,90% |
-1,07% |
2013 |
1,87% |
2,58% |
-2,54% |
8,21% |
6,97% |
2,10% |
3,20% |
0,10% |
2014 |
0,75% |
2,30% |
2,74% |
-7,79% |
-9,43% |
1,53% |
3,16% |
-0,39% |
2015 |
1,07% |
0,85% |
-0,60% |
-2,10% |
-2,47% |
0,48% |
3,42% |
-1,28% |
2016 |
1,45% |
1,27% |
1,65% |
6,31% |
7,92% |
1,13% |
3,30% |
0% |
2017 |
1,98% |
0,94% |
4,04% |
0,51% |
1,95% |
1,41% |
3,30% |
0,80% |
2018 |
1,89% |
1,45% |
1,18% |
5,36% |
3,05% |
3,29% |
2,70% |
0,69% |
2019 |
0,90% |
1,84% |
5,06% |
0,30% |
1,39% |
1,38% |
2,50% |
0,20% |
2020 |
-3,81% |
3,78% |
9,68% |
-7,31% |
-1,74% |
-2,92% |
3,50% |
-0,80% |
2021 |
2,09% |
5,10% |
-6,43% |
18,50% |
9,02% |
6,42% |
2,60% |
1,50% |
2022 |
6,76% |
0,11% |
-2,73% |
13,76% |
12,49% |
5,08% |
2,10% |
2,80% |
2023 |
4,15% |
1,24% |
6,16% |
-1,82% |
0,13% |
2,24% |
2,30% |
1,72% |
2024 |
2,71% |
7,19% |
10,76% |
0,22% |
2,99% |
3,22% |
2,80% |
0,60% |
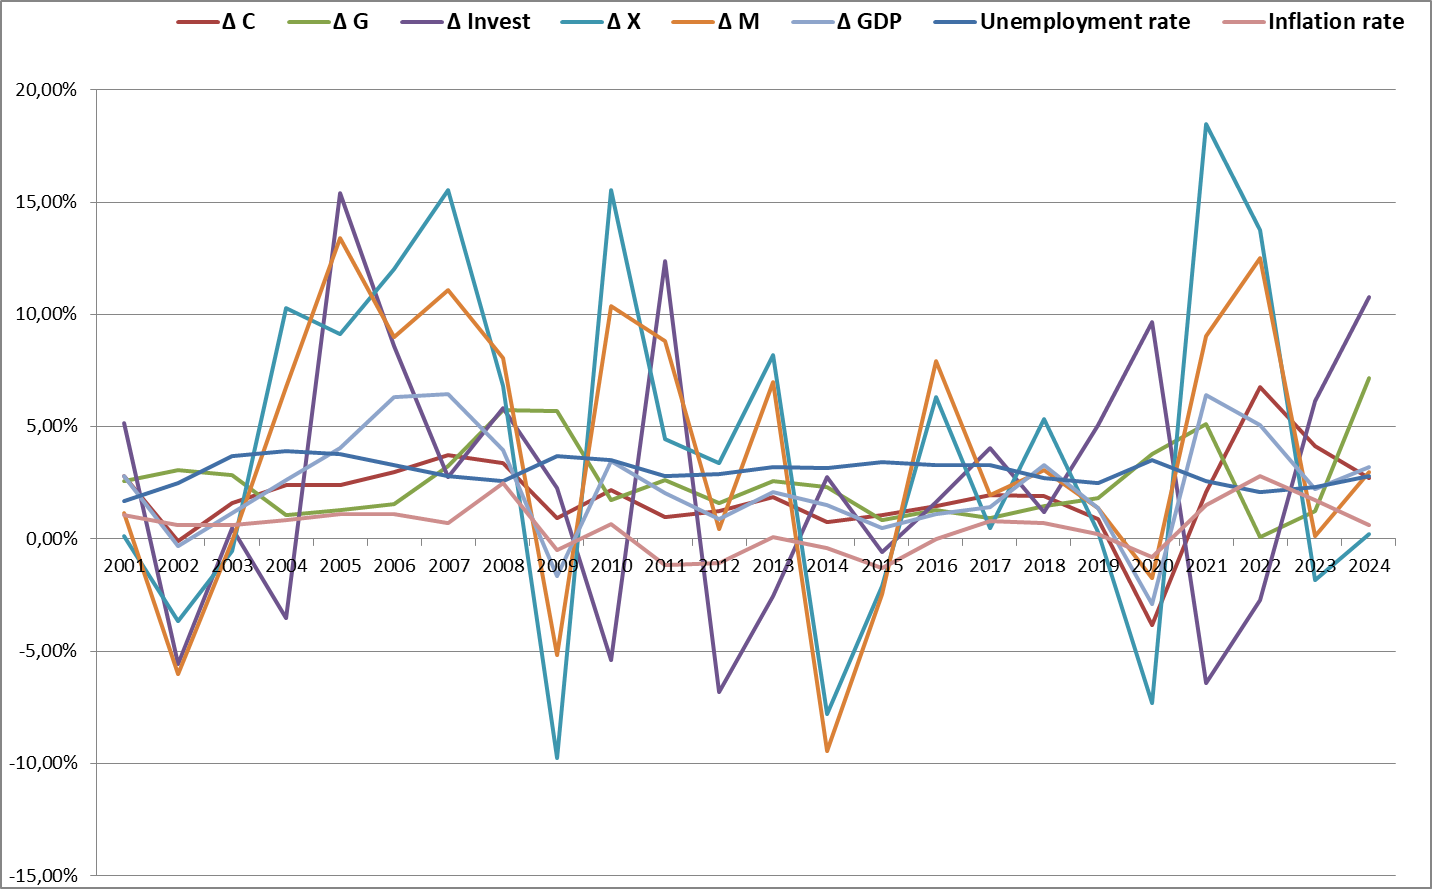
Source
: National Bank of Switzerland
© ECOFINE.COM, Bernard
Jaquier, Professor in Economics & Finance,
2025
|
|
|