|
|
|
|
|
|
|
|
|
|
|
|
|
|
|
|
Strategic
decisions & Working Capital (WC)
|
|
|
|
|
|
|
Investment
decisions |
|
|
Modes of diversification
: |
|
|
Inter-Organizational relationships
: |
|
|
|
|
|
Others : |
|
|
|
|
|
Long-Term
Financial decisions |
|
|
|
|
|
|
|
Investment
analysis and decision |
|
|
|
|
|
|
|
|
|
|
|
|
|
|
Return
on Equity (ROE)
The shareholders
point of view !
Click
here to see the source of data
Starworld
Group |
2022 |
2023 |
2024 |
| Profit After Taxes (PAT) |
305 |
450 |
715 |
| Common Stock |
900 |
1100 |
1100 |
| Retained Earnings |
300 |
405 |
550 |
| Total Owners'
Equity |
1200 |
1505 |
1650 |
| ROE |
25.43
% |
29.91
% |
43.32
% |
ROE is a basic measure of the
efficiency with which the firm employs the
owners' capital and estimates the earnings
per € 100 of invested equity capital.
It incorporates the consequences of the financing
policy of the firm, that is the way the assets
are financed. This is called the "financial
leverage".
ROE ratio can be decomposed
into 3 elements :
|
ROE
=
|
Profit |
x
|
Sales |
x
|
Assets |
Sales |
Assets |
Equity |
Click
here to see the source of data
Starworld
Group |
2022 |
2023 |
2024 |
| Profit After Taxes (PAT) |
305 |
450 |
715 |
| Total Owners' Equity |
1200 |
1505 |
1650 |
| Sales |
2784 |
3341 |
4343 |
| Assets |
2250 |
2605 |
2700 |
| Return
on sales [ Profit / Sales ] |
10.96 % |
13.47 % |
16.46 % |
| Asset Turnover [ Sales / Assets
] |
1.237 |
1.283 |
1.609 |
| Financial Leverage [ Assets
/ Equity ] |
1.875 |
1.731 |
1.636 |
| ROE |
25.43
% |
29.91 |
43.32
% |
This decomposition shows
the 3 levels for managerial control of ROE.
It also demonstrates that
two companies may have the same ROE, but resulting
from very different cocktails or strategies.
Example :
| |
Profit
margin |
x |
Asset
Turnover |
x |
Financial
leverage |
= |
ROE |
Firm
A |
6 % |
x |
0,5 |
x |
4 |
= |
12 % |
Firm
B |
2 % |
x |
1,5 |
x |
4 |
= |
12 % |
A ROE may be based on high operating
margins combined with a rather poor asset
turnover and a low indebtedness but it may
very well be the combination of low operating
margins capitalized by high productivity of
assets and a high financial leverage
Why do we want to maximize
ROE ?
Because we want
to make our shareholders happy
: fundamental objective of the firm.
How can we expect to raise
additional funds from our shareholders if
we do not provide them with a return with
the risk they are accepting to take in investing
their money in our firm ?
If you do not make your shareholders
happy, somebody is going to make them happy
for you.
There is a second
fundamental reason why we want to maximize
ROE : it is to maximize our
Self-Sustainable Growth (SSG).
What
is SSG ? It is the rate of growth
that a company can maintain (can sustain)
internally without changing its financial
structure (D/E).
The basic question is
therefore : given the firm's characteristics
how large a growth rate can it support without
distorting its D/E ratio and without raising
additional outside equity capital ?
The
fundamental relation between
ROA and ROE : the concept of "financial
leverage"
Profit
Equation :
|
ROE
= |
ROA |
+ |
[
ROA - i ]
|
. |
D |
E |
Example
Click
here to see the source of data
Income
Statement
Starworld
Group |
2022 |
2023 |
2024 |
| EBIT |
478 |
676 |
1042 |
| Interest expense |
42 |
33 |
21 |
| EBT |
436 |
643 |
1021 |
| Tax 30 % |
131 |
193 |
306 |
| PAT |
305 |
450 |
715 |
Click
here to see the source of data
Financial
structure
Starworld
Group |
End of year |
| |
2022 |
2023 |
2024 |
| L-T Debt |
1050 |
1100 |
1050 |
| Equity |
1200 |
1505 |
1650 |
| Total of financing (= net Asset) |
2250 |
2605 |
2700 |
Calculation
on a pre-tax basis
Starworld
Group |
2022 |
2023 |
2024 |
| Pre-tax ROA |
21.24
% |
25.95
% |
38.59
% |
| Interest rate |
4.00 % |
3,00 % |
2.00 % |
| D/E ratio |
0,875 |
0,731 |
0,636 |
| Financial Leverage |
15.08
% |
16.77
% |
23.28
% |
| ROE |
31.49
% |
42.72
% |
61.87
% |
Calculation
on an after-tax basis
Starworld
Group |
2022 |
2023 |
2024 |
| EBIT - Tax rate |
335 |
473 |
729 |
| After-tax
ROA |
14.89
% |
18.16
% |
27.00
% |
| Interest rate - Tax
rate |
2.80 % |
2.10 % |
1.40 % |
| D/E ratio |
0,875 |
0,731 |
0,636 |
| Financial Leverage |
10.58
% |
11.74
% |
16.28
% |
| ROE |
25.46
% |
29.90
% |
43.28
% |
Financial Leverage :
| Financial
Leverage = |
[
ROA - i ]
|
x |
D |
E |
What is this formula
telling us ?
ROE =
ROA + Leverage factor
"Leverage
factor" dependent upon 2 elements :
1. ROA - Interest rate
2.
D / E (gearing ratio)
If a firm has
no debt, Leverage factor = 0, ROE = ROA
If a firm has
debts, 3 possible situations exist :
ROA
> i : invest borrowed money
at the rate > cost of interest ; (ROA
- i) > 0 Leverage factor > 0
ROA = i
: shareholders are not benefiting from
the use of borrowed money. (ROA
- i) = 0, Leverage factor = 0, ROA = ROE
ROA <
i : Leverage factor < 0, ROE
< ROA, Return to the shareholders is
deteriorated by the use of borrowed funds.
Reasons of negative
financial leverage :
- High levels of interest
rates and depressed ROA caused by rising
costs
- increased competition
- price controls, etc...
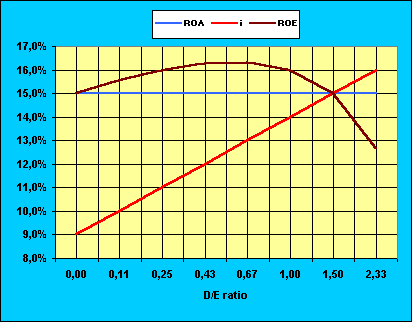
Example :
| D
/ E |
0,0 |
0,11 |
0,25 |
0,43 |
0,67 |
1,00 |
1,50 |
2,33
|
| ROA |
15
% |
15
% |
15
% |
15
% |
15
% |
15
% |
15
% |
15
% |
i
|
9
% |
10
% |
11
% |
12
% |
13
% |
14
% |
15
% |
16
% |
ROA
- i |
6
% |
5
% |
4
% |
3
% |
2
% |
1
% |
0
% |
-1
% |
Leverage |
0,00% |
0.55
% |
1.00
% |
1.29
% |
1.34
% |
1.00
% |
0.00
% |
-2.33
% |
ROE |
15
% |
15,55% |
16,00% |
16,29% |
16,34% |
16,00% |
15,00% |
12,67% |
The ROE is maximum
with a D/E ratio of 0,67.
Comments
Financial leverage can be
used on a pre-tax or on an after-tax basis.
Low interest rate = Competitive
advantage for the firm
Be very careful in interpreting
the leverage formula !
An easy conclusion : (ROA-i)
> 0 : borrow as much as possible ! but
Debts interest rate increases financial
risk.
Sources :
Interpreting
and using financial statements, 1999,
Marc Bertonèche, Ph. D. in Finance
from the Northwestern University, Professor
at the Bordeaux University and at Sciences-PO
Paris, Visiting Professor at Harvard Business
School and Oxford University.
© ECOFINE.COM, Bernard Jaquier, Professor Emeritus & Dr Honoris Causa, Lausanne, Switzerland, 2025
|
|
|